
Analytics
Acceptance, conversion and deposit analytics, broken down by method, brand and issuing bank.
Analytics digs into your payment performance beyond the Home KPIs. It's organized into two complementary views: Acceptance & Conversion (are your payments approved?) and Deposit Analytics (how do your depositors behave?).
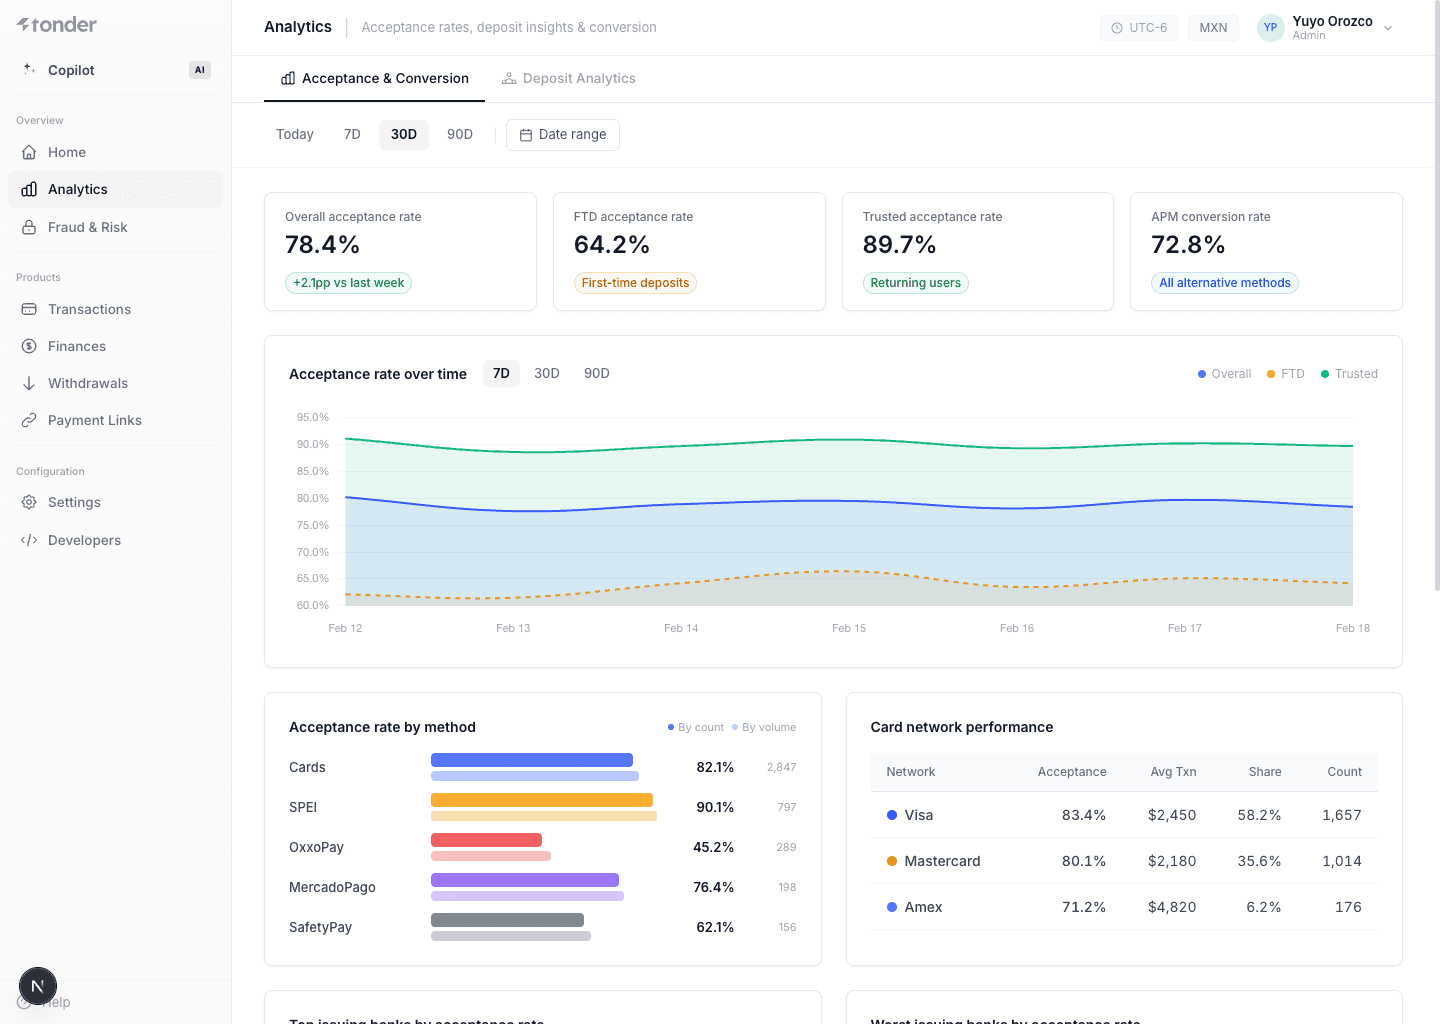
Acceptance ≠ Conversion. The acceptance rate applies to cards: payments approved by the issuing bank. The conversion rate applies to APMs (SPEI, Oxxo Pay, Mercado Pago): it measures how many payment intents result in a completed payment. They have different denominators and are never averaged into a single number.
Acceptance & Conversion
KPIs
Percentage of all card transactions approved by the issuing bank.
Acceptance rate for first-time depositors only — new customers making their first payment.
Acceptance rate for returning users who have previously completed a deposit.
Conversion rate for alternative payment methods (SPEI, Oxxo Pay, Mercado Pago). Measures how many payment intents result in a completed payment.
Charts & sections
Trend lines for Overall, FTD, and Trusted acceptance rates.
Horizontal bars showing acceptance/conversion rate per payment method (Cards, SPEI, OxxoPay, etc.).
The acceptance rate of APMs is their conversion rate.
Table with acceptance rate, average transaction, volume share, and count per card brand (Visa, Mastercard, Amex).
Excludes expired, pending, and duplicates.
Banks with the highest acceptance rates, with their authorization rate.
Excludes expired, pending, and duplicates.
Banks with the lowest acceptance rates, with their authorization rate.
Excludes expired, pending, and duplicates.
Side-by-side cards comparing first-time depositors vs. returning users on acceptance rate, average deposit, top decline reason, and preferred payment methods.
Excludes expired, pending, and duplicates.
Deposit Analytics
KPIs
Total dollar value of all deposits received in the period.
Number of new depositors (first-time customers).
Number of unique users who made at least one deposit.
Average dollar value per deposit.
Charts & sections
Bar chart (volume in dollars) with a line overlay (transaction count).
Conversion funnel: Payment initiated → Payment authorized → FTD completed, with drop-off percentages.
Includes expired and pending because it measures conversion.
Donut chart + table showing how deposits split across amount ranges ($0–500, $501–2K, $2K–10K, etc.).
Includes expired and pending because it measures conversion.
Bar chart comparing deposit and withdrawal volume with a net flow line.
Includes expired and pending.
Table of highest-value depositors with total deposited, deposit count, average amount, and preferred method.
Stacked bar chart showing volume share by method over time, plus a summary table.
No duplicates. Each payment intent is counted once. All metrics respect the date range selected at the top (Today, 7D, 30D, 90D, or custom).
How to use it
- Change the date range and compare against the previous period to see trends.
- Use the network/issuer breakdowns to route better and open cases with providers.
- Compare FTD vs Trusted to understand new-customer friction.